Draw the Calabi Yau Manifold in R
Perhaps one of the most intriguing scene in the movie “Interstellar” is when Matthew Mcconaughey falls into a five-dimensional space from where he sends messages to his daughter. The way Christopher Nolan presents the five-dimensional space is very eye-catching. Actually, it confused me for a while. The time dimension is represented by a bunch of stacks, each representing a time horizon, and when Matthew peeks through one stack, a three dimensional space unfolds. There are only four dimensions in total. Where is the fifth-dimension?
After a moment I was clear: the fifth-dimension is the “time” that Matthew is experiencing. As he browses through the stack of times, he himself is also passing through a time dimension, but this is different from the “time” represented by the stack. If this explanation is hard to understand, we can understand it another way. The world we are experiencing is four dimensional: three dimensions describing the locations of physical objects, and one time dimension that we are passing through. So although we are located in a four dimensional world, we can only “see” three dimensions. Taking this analogy, it is easy to understand Matthew’s world: if he is located in a five dimensional world, he should only visualize four dimensional objects, so there is no need to plot the fifth dimension on the screen.
A blockbuster as it is, Interstellar is criticized by some people saying that its scientific elements are too out-dated. I tend to have the same feeling. Talking about general relativity would be a cool thing twenty years ago. As a 2014 movie, maybe Nolan could have incorporated some new progress in theoretical physics. After all, general relativity was founded over half a century ago. Nolan should have taken up the challenge to introduce some more complicated, up-to-date theories to the general public. What I am saying is the string theory.

OK, I will stop digressing any further. The main purpose of this post is using R to draw a cool graph related to the string theory. One of the most interesting in string theory is that our world has far more than four dimensions - it has TEN. Besides the four dimensions we are famaliar with, there are six other dimensions that are curled and wrapped in a tiny little form, the so called Calabi-Yau manifold.
Perhaps there is no way to visualize a six-dimensional object. But we can always visualize its projection in a lower dimensional space. A popular method is introduced by Andrew Hansen, who plots its shadow in the three dimensional space. As I searched online, there are codes in Matlab, Latex and Mathematica implementing his method. It is a little shame that nobody has done it in R. After all, R is a powerful graphic software.
So here is my work. Forgive my bad aesthetic tastes.


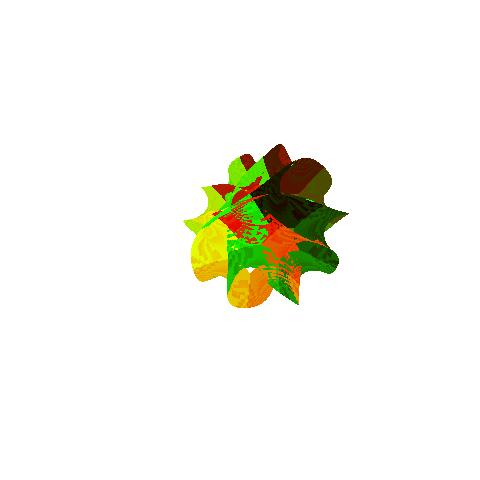
Here are the codes.