As a Ronaldo Fan, I Admit that Messi is Better
It is contraversial to draw the comparison between Cristiano Ronaldo and Lionel Messi, both of whom are God created soccer talents – until The Economist published this article. The author compared the total goals achieved by each person during the 2013-2014 season, weighted each goal by a score representing its value. Based on this method, although Ronaldo shot more goals in the season, the total value of them is less than Messi. As a result, the article concluded that Lionel Messi was the more valuable player – simply put, better.

As a Real Madrid fan, I could not help but start to evaluate the author’s methodology critically. Kind enough, The Economist published the data it used.
The biggest component in their analysis is the computation for the value of each goal. Here is the method the article uses:
The statistic that weights goals according to their context is called Expected Points Added (EPA), an application of the Win Probability Added framework originally developed for baseball. By extrapolating from over 4,000 English Premier League matches played from 2001-13, the analytical website SoccerStatistically.com offers an applet that lists the odds of a team’s win, draw or loss at any point in a match given the venue, time remaining and goal margin. Comparing these probabilities immediately before and after a goal shows how much each score changes the expected outcome.
For example, take the two situations mentioned above. With the score tied in the 90th minute, a team playing at home has an 11% chance to win, 82% to draw and 8% to lose. Multiplying by three points in the standings for a win, one for a draw and zero for a loss, its expected points (EP) are 1.13. With a one-goal lead, in contrast, its win probability shoots up to 95% and its draw odds fall to 5%, which equates to 2.89 EP. The gap between them of 1.76 points is the EPA associated with such a critical goal. In the alternate situation, with a two-goal lead in the 90th minute, the home team already has a 99.7% chance to win and 0.3% to draw. Adding on a final goal as an exclamation point is worth just 0.007 of EPA – 250 times less than the tie-breaker.
So taken it simple, the weight of value is called Expected Points Added (EPA), and the formula is:
EPA = Expected Points After the Goal - Expected Points Before the Goal.
This is a concrete idea, given that the ultimate goal of each team is to win the championship of the league. The potential caveat, though, is whether the computation of the expetected points before/after each goal is accurate. Since the authors computes the probability values based on the extrapolation from modeling 4000 matches in the English Premier League, it would be a cumbersome task to evaluate that model or investigate whether the extension from English Premier League to the Espania League created any bias. But this is a highly probable component that may draw biased conclusions! The article says that the average EPA for a Ronaldo goal is 0.48, far less than Messi’s 0.69! Is the difference between the two so huge?
My attempt to rescure Ronaldo is through a sensitivity analysis. To do so, I try to vary the probability estimates to win/draw/lose a game uniformly by 10%/-10%. This leads to 6 different scenarios. Under each scenario, I compute the average EPA for each player. My assumption is that, if the probability calculation model is biased, it is likely to be biased in the same direction, as what I try to mimic here. If no matter how I bias the probability calculation, the analysis all results in the same outcome in favor of Messi, I have to admit that the analysis is robust against such probability errors – in other words, Messi is the King.
And here are my dire results:
| Scenario 1 | Varying Probability | Match Weighted EPA, Ronaldo | Match Weighted EPA, Messi |
| 0 | None | 0.48 | 0.69 |
| 1 | Win, +10% | 0.47 | 0.69 |
| 2 | Win, -10% | 0.49 | 0.7 |
| 3 | Daw, +10% | 0.48 | 0.69 |
| 4 | Daw, -10% | 0.48 | 0.7 |
| 5 | Lose, +10% | 0.49 | 0.7 |
| 6 | Lose, -10% | 0.47 | 0.68 |
No matter which probability changes, and the direction of the change, the discrepancy between Ronaldo and Messi is consistent. The article’s claim IS ROBUST!
My second attempt to rescue Ronaldo is to exclude the world cup matches. Besides EPA, the article also adds weights of each goal according to the importance of each match. Since Argetina made to the final match in the 2014 World Cup, Messi participated to several matches with an match weights any where from 2 to 7 of a standard league match. This leads to a surge in the cumulative match weighted EPA for Messi during the World Cup season in the right panel of the graph before. We know that Portugese soccer team is not comparable to Argetinian. Maybe excluding these matches would lead to better results for Ronaldo?
So here is the corresponding graph excluding the World Cup games:
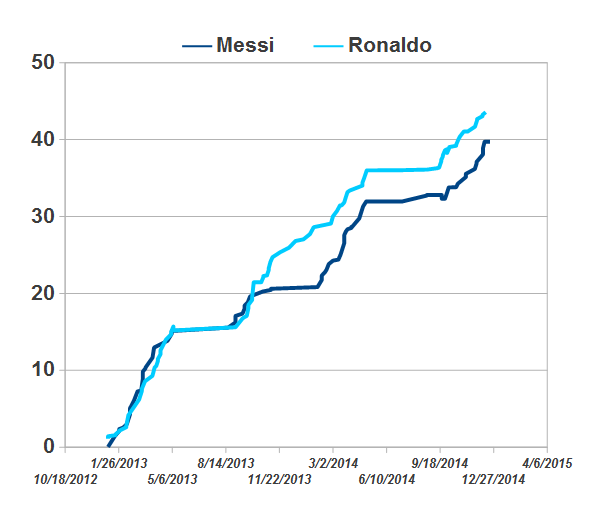
I am glad to see that Ronaldo finally beat Messi in this metric. Ronaldo scores 43.6, Messi scores 39.7. However, Ronaldo’s average EPA is 0.41, still lower than Messi’s 0.47. The good thing is that the difference is not that significant now.
The bad news? Messi was absent for 75 days in the season because of injury, missing 14 league matches because of that. Even so, the cumulative match weighted EPA is just 3.9 short of Ronaldo’s. Had he played the whole season, Ronaldo would perhaps not able to exceed in every dimension.
I am now convinced that Messi is the No.1 of this age.