How to Integrate Probabilistic Ranking from Multiple Binary Classifiers
PROBLEM
In binary classification problems, we want to separate observation units based on their predicted labels, negative or positive. Typical classifiers train probability score functions for each unit. Each probability score represents the observation’s probability to have the positive label. When we apply such a model to a testing sample, we can rank all units in the testing sample according to their probability scores. The higher the rank is, the more likely this unit has the positive sample.
Sometimes, however, we divide the training data into different subsets and build different classifiers for each. For example, if we want to identify fraudulent bank transactions, we may divide our training data by geographic locations, and build a binary classifier for each geo-unit. For another example, if we want to evaluate the default probability for different small business companies, we may divide the training data by business types and build a different classifier for each. In both these examples, we would still want to combine the results from different classifiers together and get an overall ranking of all transactions or businesses regardless of what model each of them use. Naively, we may want to rank them based on their probability scores from different classifiers. Unfortunately, this is problematic since the probability scores are not comparable. A typical problem is that the positive/negative ratio in the training data are different in each subset, and this impacts the scales of the probabilistic scores from each classifiers. Another problem is that depends on the classification model used, the probabilistic scores from different models have different distributions.
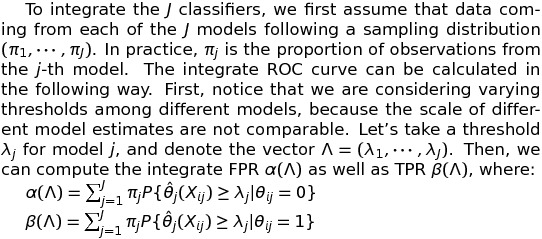
The quality of a ranked list can be represented by an ROC. Such a curve represents the sequence of “False Positive Rate”(FPR) and “True Positive Rate”(TPR) values for the top k units in the ranked list. A good ranking would yield an ROC curve that deviates from the 45-degree line as much as possible. The optimal ranking would yield an ROC curve such that, for every FPR level, the TPR value is maximized. When all probability scores are from a single model, ranking according to the probability scores are automatically optimal in this sense. Unfortunately, when the probability scores are from different models, the problem becomes non-trivial.
EXAMPLE
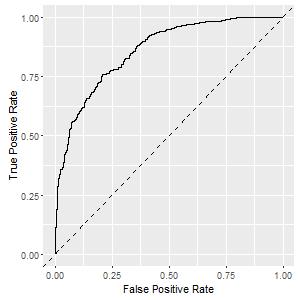
Consider the following (extreme) example. We have two ROC curves from two models, both deviate reasonably from the 45-degree line and show decent power.
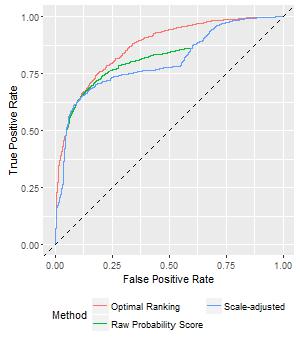
Now, consider two simple ways to join these two models: (1) rank according to their raw probability scores, or (2) according to the scale-adjusted probability scores. You may expect that ranking according to the raw probability scores are problematic, because the two set of probability scores are not in the same scale. For scale-adjusted probability scores, we devide each score by the average probability score in that model. In that way, the probability scores of the two models have the same average value.
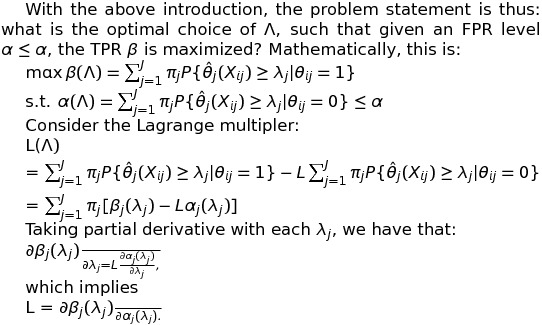
In this example, however, it is quite interesting to see that ranking using either of the simple ways does not perform well, as shown in the figure below. In fact, the scale-adjusted ranking is even worse than ranking on the original values. The reason behind it is that in this example, distribution of the two set of probability scores are quite different, so even though we apply scale adjustment, they are still not comparable. This example alerts us that the problem itself is no way as simple as it looks, and if we blindly apply scale-adjustment it can only make matters worse.
SOLUTION
In the above figure there is a winning curve labeled as ‘optimal’. As you can see, it lies above the two sub-optimal ROC curves. How is it achieved?
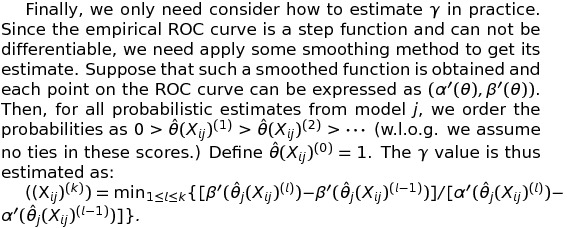
Computation method is the following: for each probability score, we look at the corresponding point at the ROC curve, and compute the slope. Of course, the ROC curve is built from some empirical model and is not smooth; we can apply some smoothing method to compute the slope of a smoothed version of it. I call such slope as the gamma-value. When we pool the probability scores from different models together, if we rank the observations based on this gamma-value, the result is optimal.
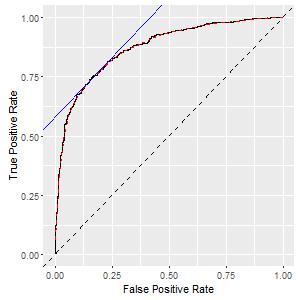
Why I call it ‘optimal’? It is optimal in the sense that for every FPR level, it is not possible to get a better TPR no matter what ranking you use. In other words, it is impossible to obtain another ranking whose ROC curve lies any where above it. This sounds too good to be true, but I have the mathematical proof at the end of this post.
I know you would not like read it, so let’s first try to interpret the intuition behind the gamma-value. The slope of the ROC curve tells us the ‘marginal’ power if we label each observation as positive. This value is not impacted by the scale of the probability scores, or the distribution of the probability scores. In fact, it is invariant for any monotone transformations on the probability score. Therefore, such value is comparable between different models.
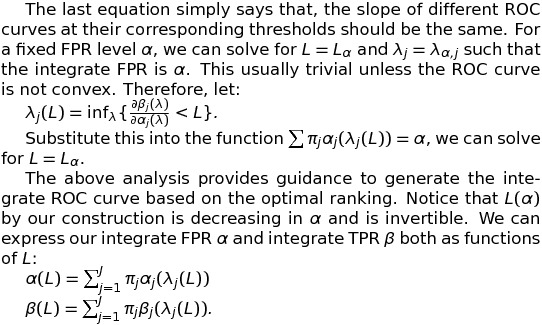
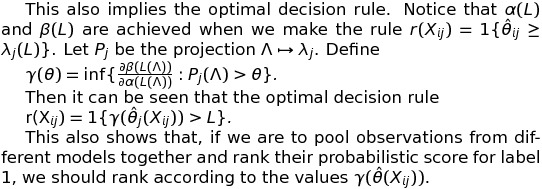
MATHEMATICS
The mathematical arguments are attached below, although they are dull. And as always, the codes to reproduce the example in the post are attached here.
(c)2016-2025 CHANDLER ZUO ALL RIGHTS PRESERVED