Does the COVID Death Rate Associate with Demographic Features?
Talking about mortality during this world-wide pandemic is nothing easy, but there are questions to ask. In an ideal world where people have equal access to medical resources, deaths after COVID infections would be purely in the control of the God’s dice, and we expect to see equal death rate across regions. Noticeably, there is difference between the death rate and the number of infected people or mortality. The number of infections can be influenced by factors outside the medical system, for example how government enforces regulations to control the disease spread. Mortality is the multiplication of the number infections and the death rate, thus is under the influence of the same factors. Death rate, on the other hand, relies mostly on access to medical resources. After one gets infected, how promptly and properly can they get treated?
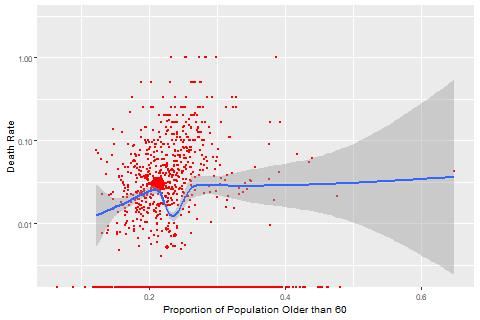
Death rates across US so far differ wildly across different regions. Real-time COVID monitoring built by 1point3acres provides county level statistics. These numbers can be linked with the demographic information from Census Bureau to enable some analyses. Some demographic features presumably can be correlated with death rates. An example is the proportion of aged people. Politicians tell us that COVID is more fatal to old people than young people. The following figure compares the county-level death rate with the proportion of population greater than 60. It seems the positive correlation is true when the proportion stays below 35%, but becomes less pronounced when the proportion exceeds that.
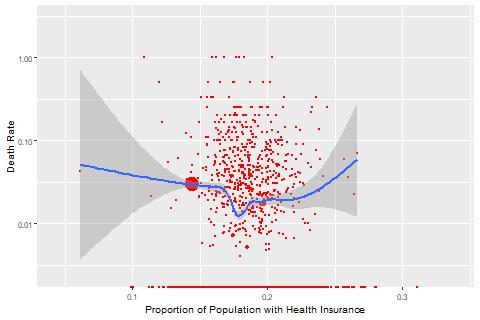
Another example is the proportion of population with health insurance. There are two possible patterns. If infected people need to rely on their own health insurance for treatment, we expect to see negative correlation between health insurance coverage and death rate. Alternatively, if government strongly subsidizes the health system to battle this pandamic, infected people can be treated regardless of their health insurance status, which means such correlation would not exist. Our data seem to support the former.
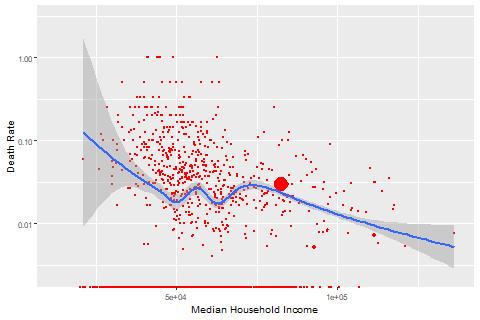
A more disturbing example is the median household income. We hope to see no correlation between income levels and COVID death rates, assuming that in an ideal world medical resources are deployed to all regions independent of their economic status. Data, however, show negative correlation between the two, and the correlation even seems to be stronger than the correlation with the proportion of aged population. Comparing counties with median household income below 50K with those above 100K, death rates are mostly above 3% for the former counties and below 3% for the latter.
Features can have confounding effects. The proportion of aged population can be correlated with median household income. Once controlling other factors, what is the effect of median household income? To answer such questions, I run a Generalized Linear Model with binomial distribution including the aforementioned three variables. Backward selection is used to exclude insignificant variables. Proportion of population older than 60 is the only variable that is excluded. The model results are shown in the following table. To interpret, every 1% increase in health insurace coverage is associated with 4.44% decrease in the log odds of COVID death rate, and every $10K increase in median household income is associated with 3.35% decrease in the log odds of COVID death rate.
| Variable | Coefficient Estimate | P-value |
| Intercept | -2.700e+00 | < 2e-16 *** |
| Median Household Income | -3.350e-06 | 0.000164 *** |
| Proportion of Population with Health Insurance | -4.444e+00 | 2.5e-06 *** |
Correlation is not causation. Factors outside this model may play a role in reality. For example, maybe counties with higher income also have better educated population, and thus are more informative to take early actions when symptoms develop. To improve this model along this direction, I include more demographic features. The next model I build includes the following features:
- Median household income;
- Proportion of population with health insurance;
- Proportion of college educated population;
- Proportion of female population;
- Proportino of population older than 60;
- Proportion of families in different races. There are 7 races from census data: Non-hispanic White, Hispanic and Latino, Black and African American, Asian, Native Americans and Alaska Natives, Native Hawaiin and Other Pacific Islander, Some other race, Two or more races. The model includes the last 6 races to avoid multi-collinearity.
The model results are in the following table:
| Variable | Coefficient Estimate | P-value |
| Intercept | -3.8715 | < 2e-16 *** |
| Proportion of Population Older than 60 | 2.0019 | 2.34e-05 *** |
| Proportion of Population with College Degree | -1.1698 | 3.37e-08 *** |
| Proportion of Families with Two or More Races | -3.4262 | 0.0533 . |
| Proportion of Black or African American Families | 0.6147 | 6.11e-08 *** |
| Proportion of Asian Families | 2.6453 | 3.85e-13 *** |
| Proportion of Families with Some Other Races | -1.5529 | 6.83e-05 *** |
| Proportion of Haiwaiian or Other Pacific Islander Families | -11.2095 | 0.0966 . |
The results are drastically different from the first model. After introducing additional demographic variables, both median household income and health insurance coverage are no longer significant. Rather, the most significant factor is the proportion of Asian Families. Controlling all other factors in this model, with every 1% increase in the proportion of Asian families, there is 2.64% increase in the death rate. This effect is even larger than the proportion of aged population. Another race that is fared less fortunate than other races is the Black and African Americans. Every 1% increase is associated with 0.61% increase in COVID death rate.
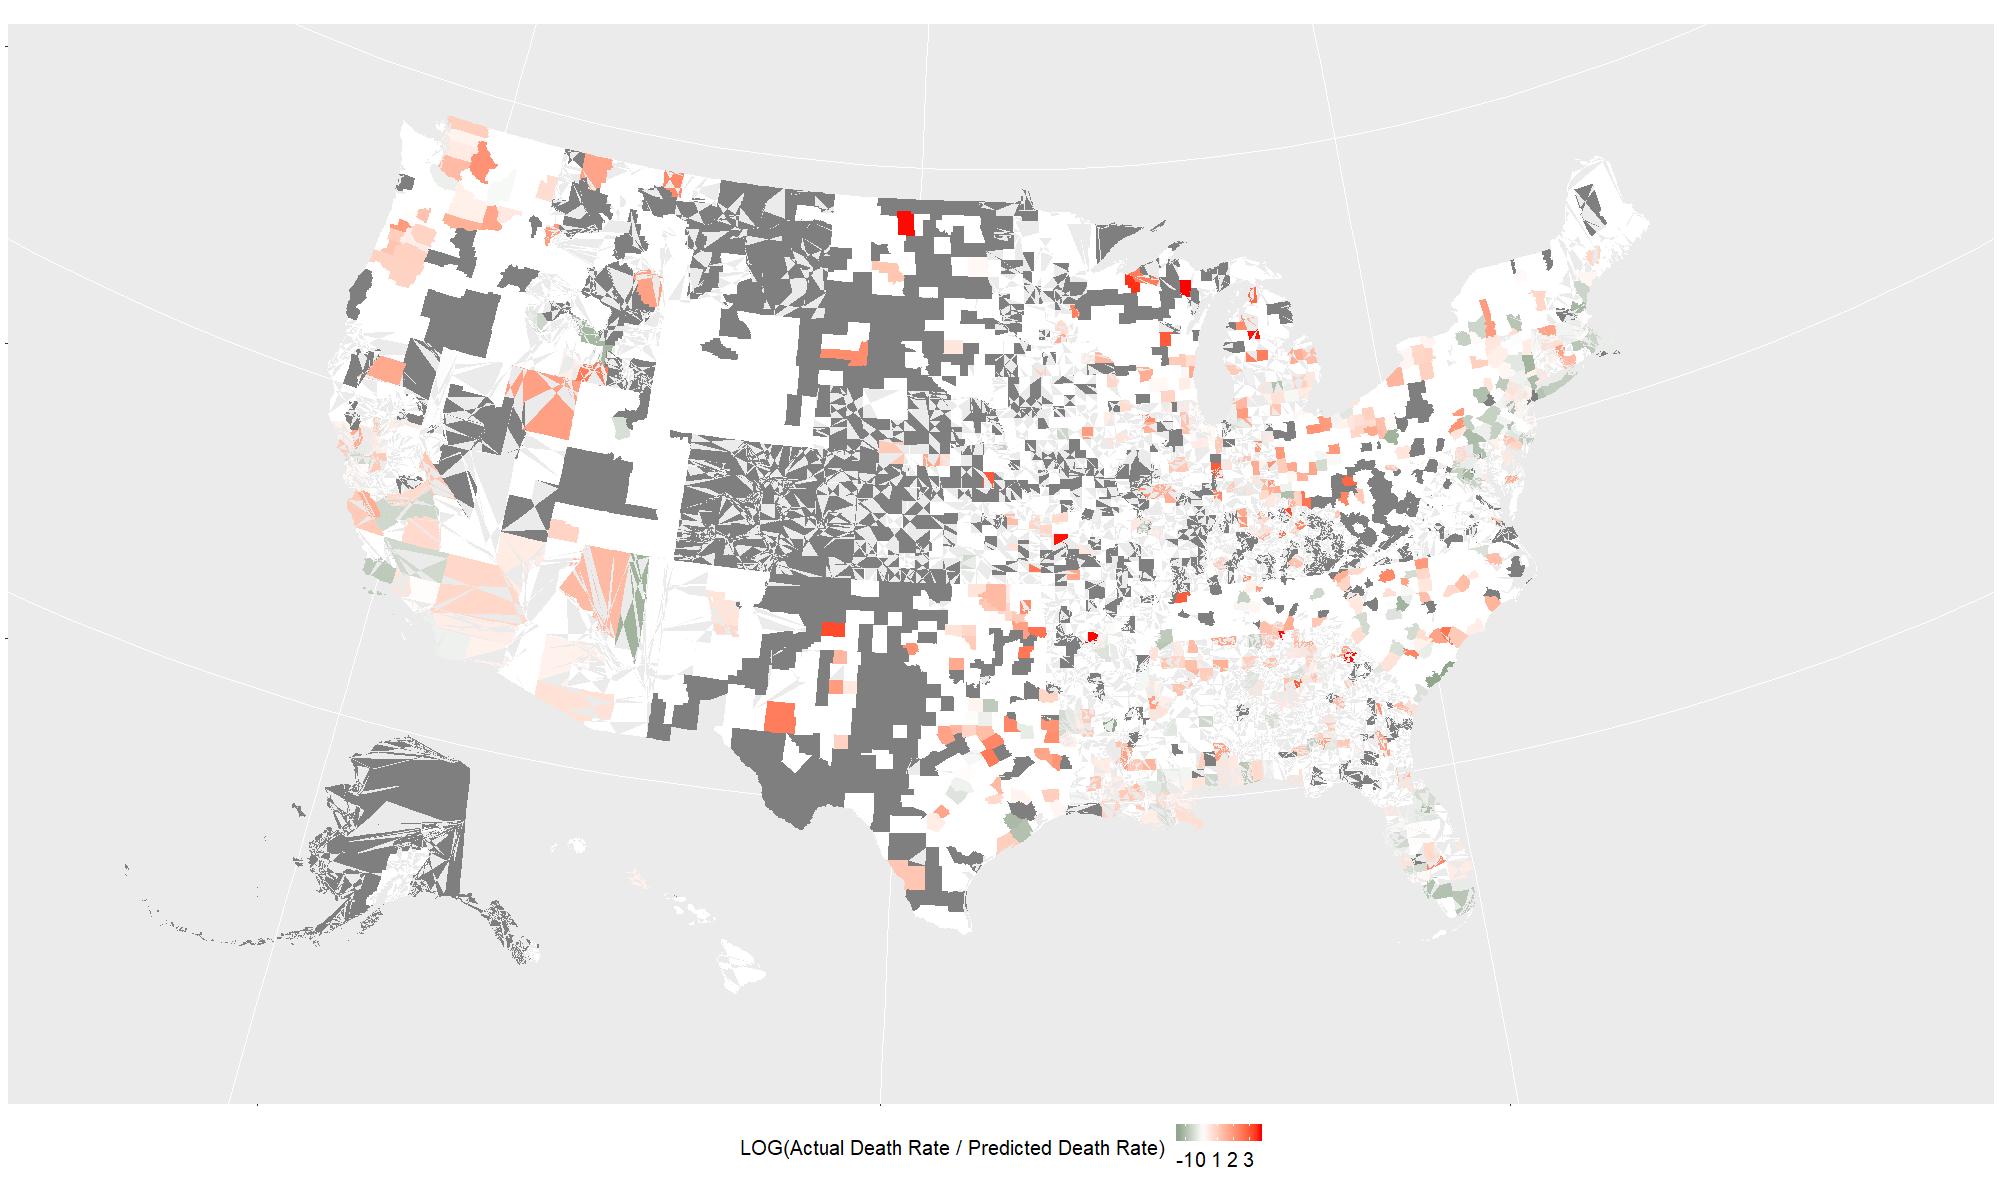
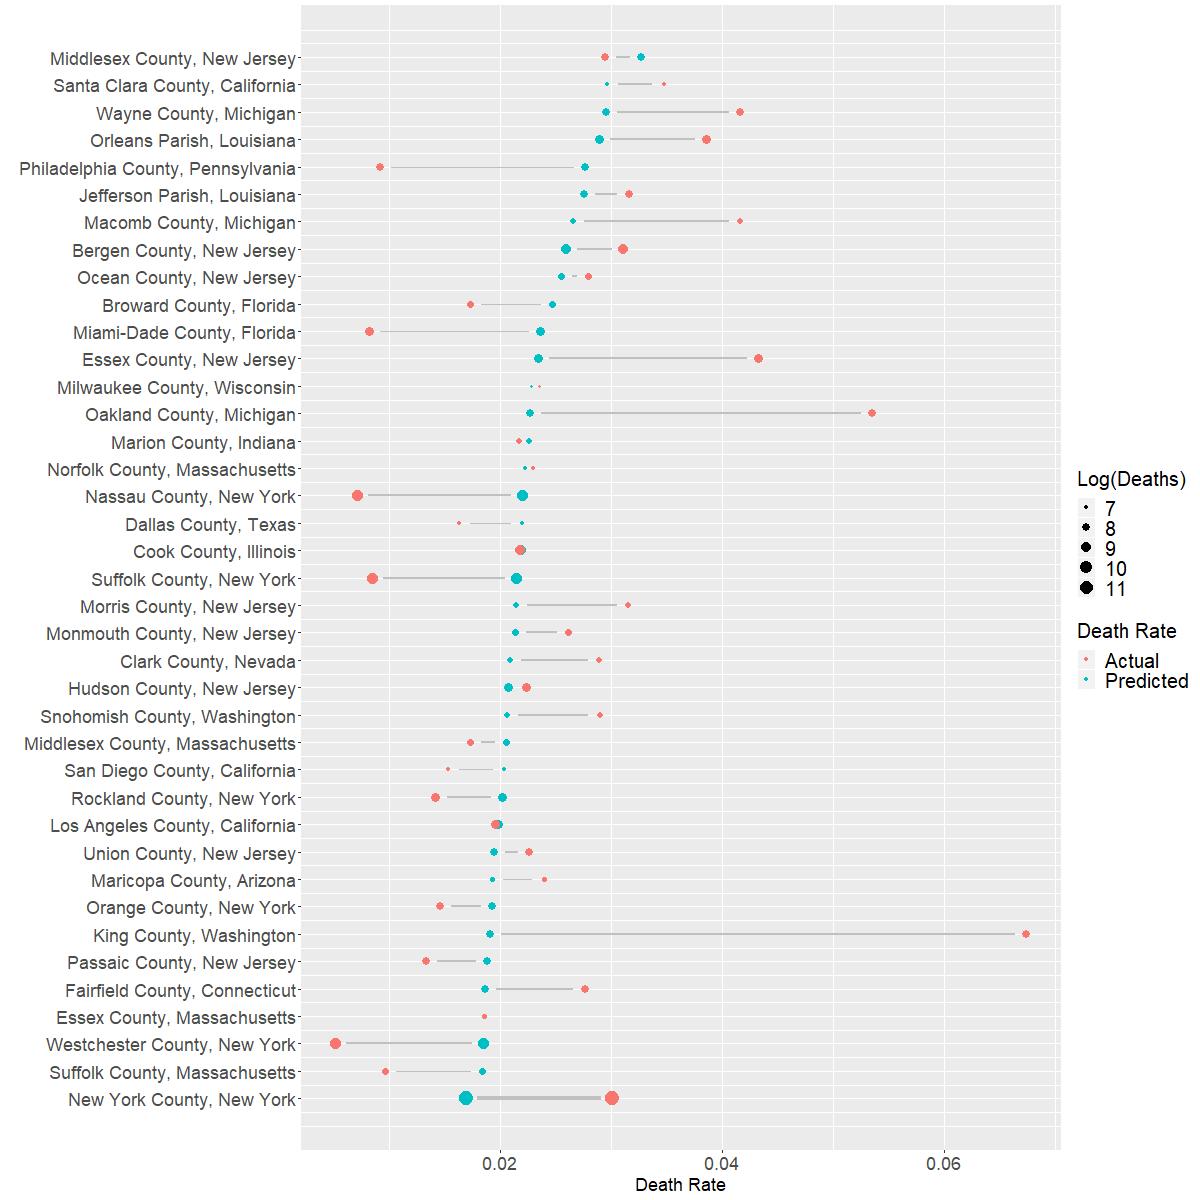
How does this model fit? The following figure shows the log ratio of the actual death rate v.s. the predicted death rate.
My model apparently has many shortcomings, which include but are not restricted to:
- I calculate death rate by dividing the reported number of deaths by the reported number of infections. Because mortality happens at the delay of infections, this measure underestimates the death rate for counties where COVID has just begun to spread. Ideally I need to find cohort data to calculate mortality rates.
- Counties with limited testing may also show high death rate because the number of reported infections underestimates the true number of infections.
- The model may indicate regional inequality of medical resource allocation, but it gives no direct proof. If we can obtain medical resource allocation data, we may be able to associate that with the census demographic information to answer that question properly.
For counties with at least 1K infections, this figure shows how the predicted death rate differs from the actual death rate. Food for thoughts:
- For counties where my model underpredicts, are they running short of medical supplies? Do they need more media coverage?
- For counties where my model overpredicts, do they have some successful lessons that can be shared broadly?
TECHNICAL DETAILS
CENSUS DATA
I use 2018 American Community Survey 5-year Estimate data for county-level demographics in the US. Information on how to download data can be found on Census Bureau’s developer website.
COVID DATA
I manually copied data from 1point3acres Live-time Report snapshot on 4/4/2020 at 2pm EDT.
DATA ANALYSIS
The final model includes 2238 US counties where I can match COVID data with the ACS survey data.
6 counties are excluded from model fitting because they have high leverage according to the Cook’s distance. These counties are shown in the table below. Acknowledgably, they are the most infected counties by COVID in the US, but they also show quite distinct pattern compared to other US counties. The model excludes them in order to analyze the pattern for general US counties.
| State | County | Infected | Death |
| Florida | Miami-Dade | 3667 | 30 |
| New York | Nassau | 13346 | 95 |
| New York | New York | 63306 | 1905 |
| New York | Suffolk | 11370 | 96 |
| New York | Westchester | 13081 | 67 |
| Washington | King | 2787 | 188 |
All codes can be found here.
(c)2017-2026 CHANDLER ZUO ALL RIGHTS PRESERVED